Search "Independence KS home prices" this month and you'll land on three numbers that don't agree with each other. One source shows prices up almost 98 percent this year. A second data feed, tracking the same zip code, shows a small decline. A third puts the town's average home value below nearly every other figure on the page. None of these sources made a mistake. Each one is measuring something slightly different, in a market small enough that the difference shows up loudly instead of getting smoothed away.
That gap is more than a curiosity if you're actually pricing a house or comparing Independence to somewhere else you're considering. Walk into a listing conversation anchored to whichever headline median loaded first, and you'll start from the wrong place. The fix isn't hunting down the one "correct" number. It's understanding why none of these figures, taken alone, tells you much about what a specific house here is worth.
Same Two Months, Two Opposite Stories
Here's what three different measurements of the same town produced this year, side by side:
| Source |
What It Measures |
Time Window |
Result |
| Redfin |
Sold price per square foot |
3 months ending April 2026 |
$96/sqft, up 58.2% year over year |
| Movoto |
List (asking) price per square foot |
June 2026 |
$91/sqft, down 3% year over year |
| A national home-value estimator |
Blended average value across all homes, listed or not |
Current 2026 estimate |
Roughly $93,700 |
Two months apart, in overlapping windows, one data feed says Independence home values nearly doubled and another says they slipped slightly. That's not three opinions about the same fact. It's three different questions being answered at the same address. One tracks what buyers actually paid at closing. One tracks what sellers are currently asking, whether or not anyone has agreed to pay it. One blends every home in town into a single average whether it's on the market or not.
Why the Sold-Price Number Swings So Hard
The sold-price figure is the one that jumped 58.2 percent, and the reason isn't a sudden shift in what buyers want to pay. Redfin's own count shows 24 homes sold in Independence in April 2026, up from 22 the same month a year earlier. Two additional closings. In a market that thin, whichever homes happened to sell that particular month decides the headline, not a broad change in buyer behavior.
Contrast that with a metro market where hundreds of closings happen in a single month. One outlier estate sale or one distressed foreclosure gets absorbed into an average built from a large enough pool that no single transaction moves it far. In Independence, a single county-road sale priced above $300,000 sitting next to a run of $50,000 to $90,000 in-town starter homes can shift a median by thousands of dollars on its own, and a single acreage closing priced in the high six figures can shift it further still.
There is one piece of this data that does describe a real, steady shift rather than noise: days on market fell from 43 to 35 over the same year-over-year comparison. That's a smaller number and a more consistent one, and it's a better signal that something in the local market genuinely moved than the price swing sitting next to it.
Asking Price and Sold Price Aren't the Same Conversation
The Movoto figure showing a 3 percent decline isn't contradicting Redfin's 58.2 percent gain. It's answering a different question. That number tracks what sellers are asking on homes currently listed, filtered through whatever mix of properties happened to hit the market that month, not what buyers ultimately agreed to pay. A town can show asking prices drifting down at the same time sold prices spike, if the homes that closed that quarter simply weren't the same homes that are sitting on the market being priced today.
That's worth sitting with if you're comparing Independence to another town using a single stat pulled from a portal's homepage. You may be comparing an asking-price snapshot in one place to a sold-price snapshot in another, and drawing a conclusion neither number supports.
What's Actually on the Market Tells a Clearer Story
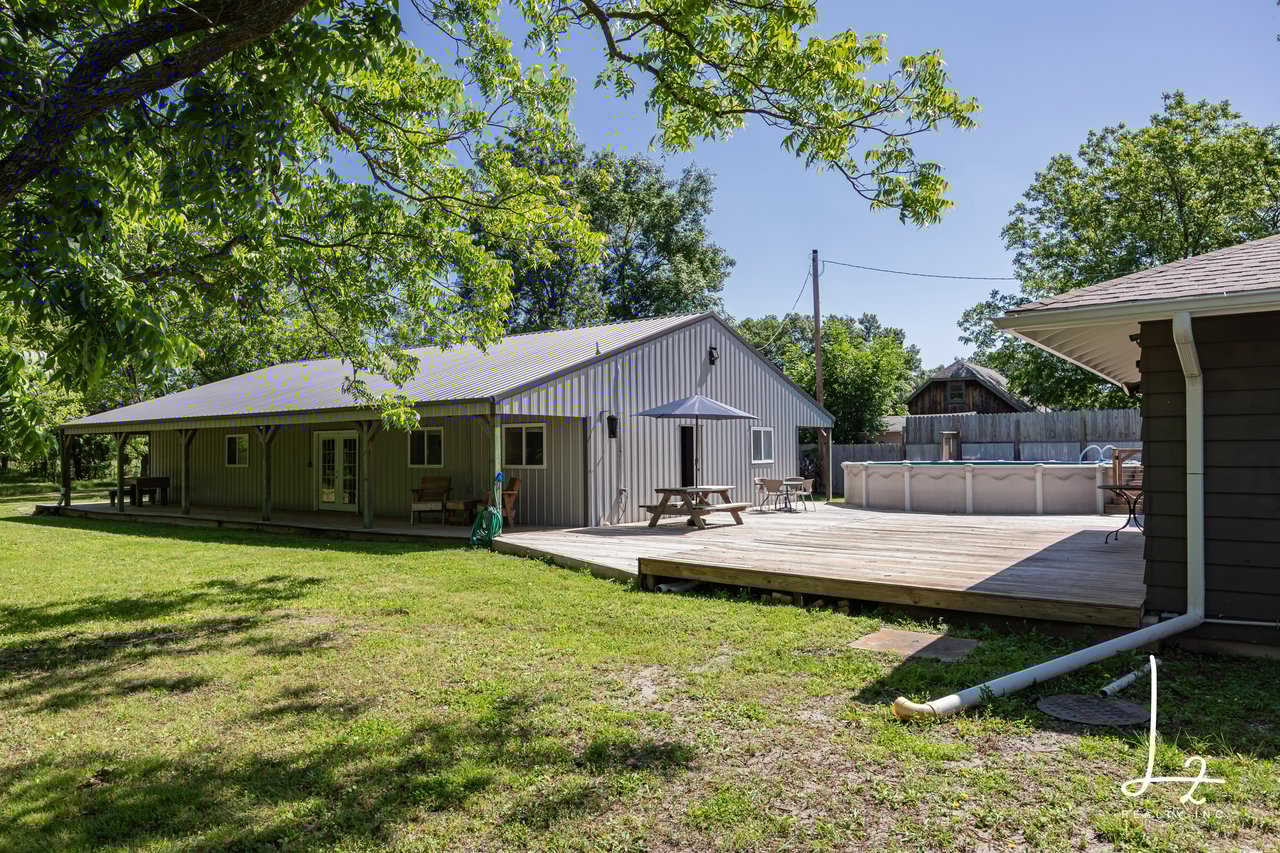
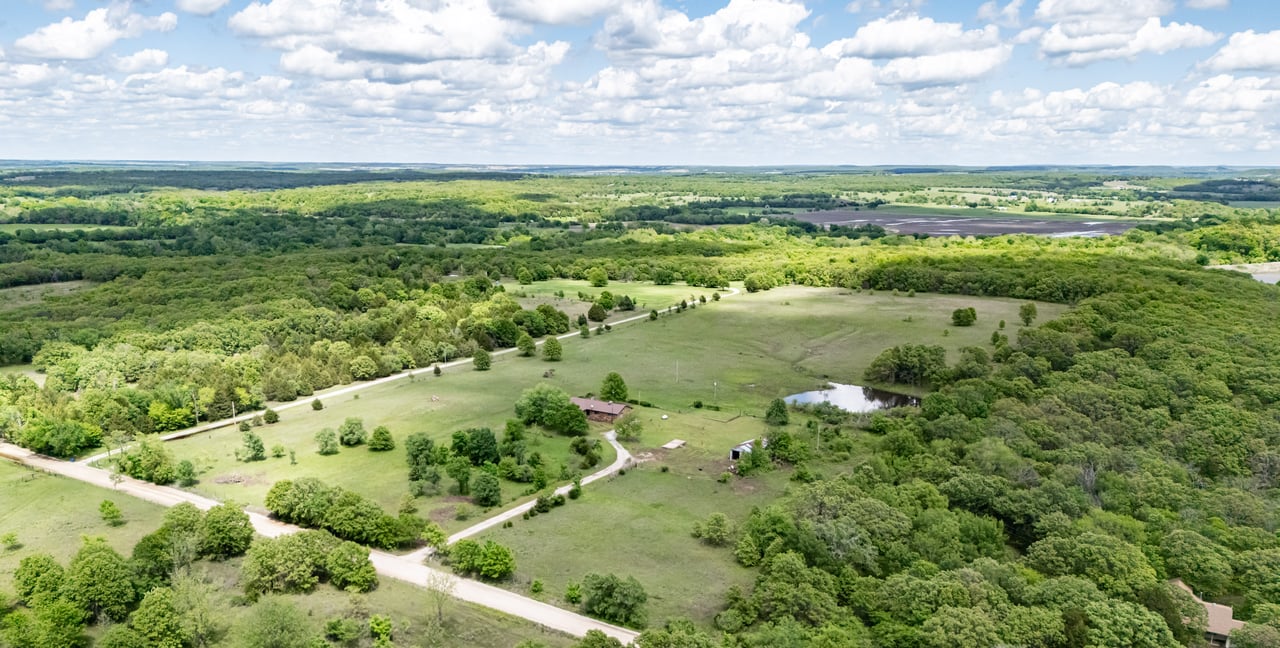
The clearest picture of Independence right now isn't a median at all. It's the spread of what's actually for sale in the 67301 zip code as of this month. Active listings currently range from a $14,990 fixer on Cottonwood Street to in-town homes in the $50,000 to $60,000 range, up through a $238,500 county-road property, and all the way to a $1.9 million acreage estate outside town limits, offering more than 6,000 square feet on its own parcel. All of those are technically "Independence" homes. None of them describe the same buyer, the same neighborhood, or the same kind of transaction.
That spread also explains why size comparisons get muddy. One regional listing feed puts the average size of a home currently listed in Independence at just over 2,000 square feet, noticeably larger than the roughly 1,720 square foot average across Montgomery County as a whole. When county-road and acreage properties make up a bigger share of a given month's activity, the town's average home gets larger and pricier without a single in-town buyer or seller doing anything differently.
What This Means If You're Pricing or Comparing
If you're pricing a home to sell, the headline median from any single site is close to useless on its own. What matters is the closed sales of homes that actually resemble yours: similar square footage, similar age, in-town versus county-road versus acreage, over the same recent window. Two homes both labeled "Independence, KS" can sit in entirely different price conversations depending on which of those categories they fall into.
If you're comparing Independence to another town while relocating, the same caution applies at a larger scale. A handful of high-volume Kansas metro suburbs can dominate a statewide sales count enough to pull a state median toward a price point that has nothing to do with Southeast Kansas. The safer habit is to ignore statewide or countywide averages entirely when the question is one specific town. For readers who want a neutral, non-market-specific check on where Kansas values sit broadly, the Federal Reserve Bank of St. Louis publishes a quarterly statewide house price index, with its next update due August 25, 2026.
A Few Questions Worth Settling Upfront
Which number should I trust if I'm comparing Independence to another town?
None of them by themselves. Pull actual closed sales of comparable homes, matched on size, age, and property type, over the same window in each town. A single headline median from either place tells you less than a side-by-side comparison of five or six similar recent sales.
Does this mean home prices in Independence are rising or falling this year?
Both descriptions are defensible depending on which measurement you choose, and that's the actual finding here. The more honest read is that the market is thin enough that month-to-month swings mostly reflect which specific homes happened to close, not a clear, sustained direction in either one.
Move With Confidence, Not a Headline Number
A portal median can tell you a story about Independence. It can't tell you what your specific house, on your specific street or acreage, is actually worth in today's market. That takes a look at the real comparable sales behind the number, not the number itself.
If you're trying to figure out where your home actually sits in a market this thin, Kristina Fulk can walk you through the comparable sales that matter for your property type, in-town or acreage, and put a real number behind it. Get Your Instant Home Valuation to start.